
Category Archives: Dr Rob’s LabLog
The End of Data Collection – so what happens next?
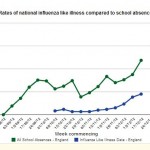
Now that we’ve entered the summer term it’s time to stop collecting the weekly school absence data. Did I just hear a sigh of relief? The national data suggest that whilst there is still small amounts of flu circulating, levels … Continue reading
Investigating the epidemiology of flu, Big Brother style
In these LabLogs I’ve talked endlessly about how we can’t predict the start of an influenza outbreak. Despite this, you might be surprised to learn that there are many things still to learn about how influenza is transmitted from one … Continue reading
The Bigger Picture
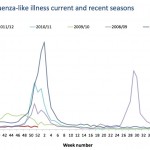
The flu season has been as unpredictable as ever this year; in this blog Dr Rob looks at data from the UK and across Europe to try and understand the bigger. I’ve said it before, and I’m sure I’ll say … Continue reading
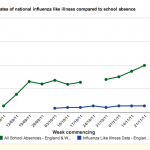
The week four blip
In week four there was an increase in the number of school absences, similar to a peak just before the Christmas holiday. Was this due to flu, or are there other possible explanations? It would be fair to say that … Continue reading
Drawing DecipherMyData graphs – proceed with caution.
The way a graph is drawn can have a big influence on how the results are interpreted. In this lab log Dr Rob discusses some of the dangers in drawing graphs with DecipherMyData . Most of the analyses we’ll be doing … Continue reading
Deciphering the data – influences of other viruses on absence levels
Infections other than flu could influence the school absence data. In this post, Dr Rob looks at whether two other common viruses influence DecipherMyData’s results. As some of you highlighted in the LabLogs, a big limitation with our school absence … Continue reading
The big news this month..
The Flu season has officially started. We’ve noticed that over the past three weeks there has been a reported increase in the number of people visiting their GP with flu like symptoms. The greatest number of those visiting has been children … Continue reading
Missing data – the silent problem that’s finally causing a noise
Systematic reviews of research give more reliable evidence of the benefits and risks of treatments, yet they are often hampered by missing data. Dr Rob joins others in calling on drug companies to publish all their data and reassures that … Continue reading
Flu scientists get colds too!
A few people at work have come down with colds over the last couple of weeks. So far I’ve managed to avoid getting unwell, possibly because my years of working on a hospital ward have left their mark in the … Continue reading
Watching for flu – we need your data
The big news keeping us flu watchers busy this week is the new coronavirus contracted by a patient from the Middle East who recently arrived in the UK. We’re interested because it is new and the only other person known to have … Continue reading
Flu over the summer
Decipher my data wasn’t collecting absence levels over the summer as schools were on holiday and there typically isn’t much flu around during this time. However, research and public health work preparing for the flu season goes on, so what … Continue reading
Why season two is important
Hi! I’m Dr Rob, and I’m helping to run the flu project again this year. Just like last year, we can’t be sure what we will find, but we do think that it is important. Why flu is important In … Continue reading
Blink and you could have missed it
Research projects tend to go on for a long time, but to me at least, this one has gone in a flash. It only seems like yesterday when we began collecting data from schools, but in fact we actually collected … Continue reading
Detecting the unpredictable: the start of a flu season
A variety of factors trigger a flu season, making it difficult to predict. We don’t fully understand these factors yet, let alone how they are linked. It’s because we can’t forecast the start of the season that we carry out … Continue reading
Got something to say about the data? Write a LabLog!
There is now a new data analysis tool on the site; XY scatter graphs. These graphs will help you examine whether school absence due to flu is linked to variables, including percentage of pupils on free school meals and average age … Continue reading
The school holidays: a break in the data
The school holidays over Christmas might have given schools a welcomed break but they also stopped us from collecting data for couple of weeks. This is one of the main scientific limitations of this project, as it means we can’t … Continue reading
How to make an epidemiologist happy
After months of planning and hard work we’ve got some data! There’s now a graph on the welcome page for you to look at, this is being updated with data as it comes in. Because it’s live data don’t be … Continue reading

The known unknowns
In 2002 Donald Rumsfeld (the former United States Secretary of Defense) made a famous speech describing categories for what US intelligence services did and didn’t know about Iraq and it’s supply of weapons of mass destruction. One of Mr Rumsfeld’s categories … Continue reading

Icebergs, outbreaks and Flu
The Flu! project is all about trying to create a new and exciting method of Flu surveillance. When epidemiologists talk about surveillance, they mean the continuous collection, analysis and interpretation of data that be used to prevent and control diseases. … Continue reading
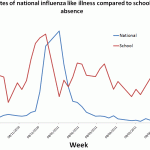
What’s been deciphered so far?
Before launching the Flu project across the country we wanted to test our data collection process. One school kindly volunteered their illness absence data for the whole of last year, which is plotted in the graph. Here’s a quick explanation … Continue reading
