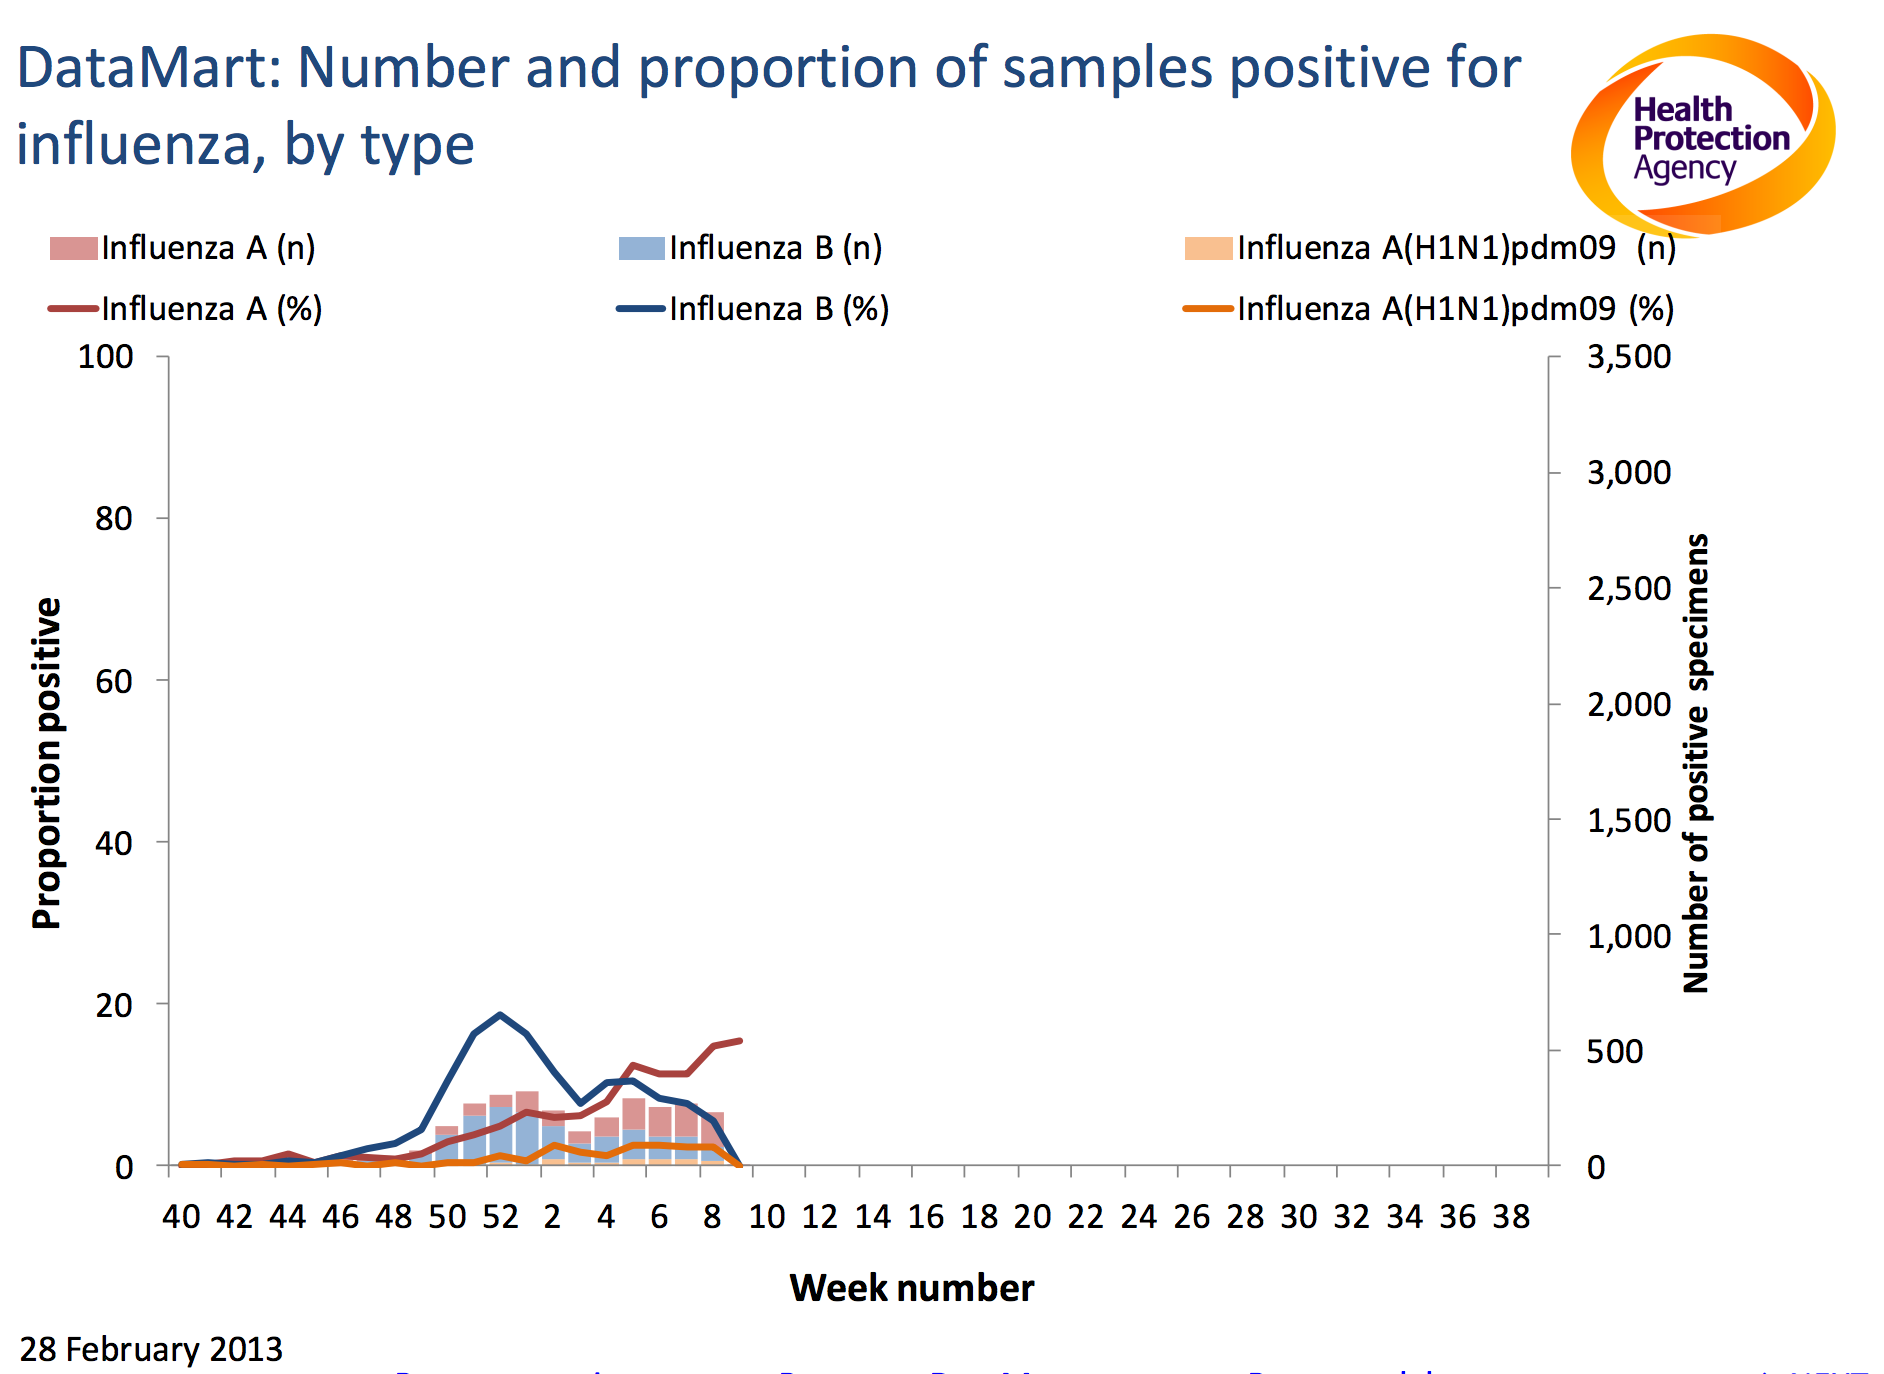
Graph showing the number and proportion of samples positive for Influenza A and B. Graph taken from the HPA weekly influenza report week 8.
I’ve said it before, and I’m sure I’ll say it again, but flu seasons are unpredictable. This year has been no exception: there was a relatively small peak in December, then the number of cases went down in the New Year.
In week four our school data looked interesting as it started to go up again and in week seven the national data showed a slight increase. We don’t know what the school data for week 9 shows yet, but it will be interesting to see what’s happening now that schools are back from half term.
So is the flu season over or can we expect another peak? At the moment there’s some evidence for both possibilities.
As some of you will already know, there are two main types of influenza virus (A & B). Every week samples are taken from people with symptoms of flu in hospitals across the country which are then tested for influenza and other viruses found in the lungs. The results of these tests tell us about the proportion of people with ‘flu like symptoms’ that actually have viruses in their bodies as the cause of their illness. Interestingly, the proportion of positive samples for influenza A have been gradually been going up over the last few weeks, with most of what we’ve seen so far this year probably being due to influenza type B.
This gradual rise in influenza A might suggest that we’re about to see another peak. On the other hand though data from across Europe (collected using methods comparable to here in the UK) suggest that whilst most countries have currently have flu circulating in the community, there were more countries with decreasing rather than increasing levels during week eight. These data give us the bigger picture, but what’s going to happen during the rest of the flu season? I don’t know, but watch this space and your data to find out.


