As part of our carrying out of the Decipher My Data (Flu) project at our school, we analysed the relationship between the illness absence data from our school (sourced from SIMS), and the nationwide influenza data provided by the Royal College of General Practitioners as a group of seventeen year 12 students. The nationwide influenza data was defined as the number of individuals across England and Wales going to see their General Practitioner with Influenza Like Illness (per 100,000 of the population), and is regarded as one of the most reliable indicators for the prevalence of influenza in a population. Overall, from the graphs shown on the Decipher My Data website, it appeared that our school’s rate of illness absences were slightly lower than the England average for illness absences in schools from September to February, except for some periods in November.
Our school is located in Kingston upon Thames in outer London, and has a relatively affluent pupil intake, owing to relatively affluent areas being located in South West London, such as Richmond upon Thames and Kingston upon Thames, which are some of the least deprived areas in London and England. Our school also has a relatively high educational attainment rate, with 99-100% of students achieving 5-A*-Cs at GCSE, which can be attributed to the entrance exams that prospective pupils must take in order to enter the school. As there is no catchment area utilised in the admissions process for our school, this means that pupils can come from non-local areas via public transport. This could provide an extra opportunity for the transmission of influenza due to the high numbers of people in close proximity on public transport, which would aid the spread of disease via airborne droplets or the many surfaces that people would come into contact with.
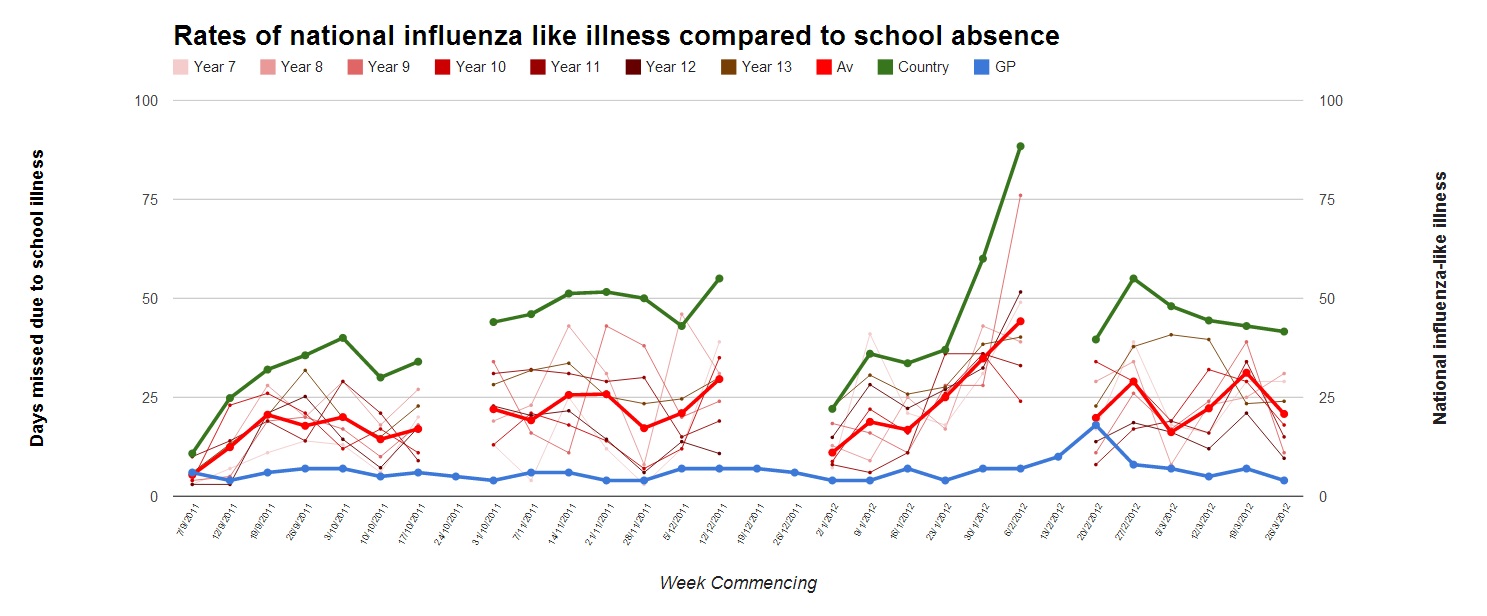
In terms of the national trend of illness absence rates, the rate increases steadily from the start of term in September to the end of September to 15 days missed per 100 students due to illness, before continuing to fluctuate around 10-15 days missed per 100 students until the beginning of December, before increasing in the two weeks before Christmas to almost 30 days missed per 100 students due to illness (almost twice the previous number of days missed). There was then a two week gap due to holidays, and the number of days missed had returned to around 13 days per 100 students, before increasing to around 25 days per 100 students.
Our school’s data broadly followed the national trend, but generally had lower absences due to illness than the national average, which may be because of the importance of high grades and maintaining a high standard of academic work that is very much promoted at our school, which may mean that students which have influenza may still be attending school because they feel under pressure to attend classes and keep up with their studies, which contributes to what could be described as a culture of ‘presenteeism’ at the school. This may mean that relying on illness absence data may not be so reliable as a method of identifying the number of students with influenza. School absence data can also be affected by a number of other factors, such as exams. Students may either embrace the culture of ‘presenteeism’ and attend school even when they are ill, or they may take days off and feign illness in order to revise for upcoming January exams, which is in effect a form of study leave. However, the trend for Year 11 students at our school, which had formal GCSE January exams, showed that the number of days missed per 100 students was not significantly higher than the school aggregate value, which suggests that most of the year chose to come in for lessons instead. However, the added pressure of exams, which could cause illness due to additional stress in the run up to exams, also needs to be taken into account. Of course, data from SIMS is wholly reliant on the honesty of pupils and parents, and obviously the reliability of the data may be negatively affected if there are a large enough minority of students ‘playing truant’.
In terms of influenza illness data, this remains fairly stable at around 5 individuals per 100,000 going to see their GP about influenza from 08/10/12 to 05/11/12, before increasing from 12/11/12 onwards to a peak of just over 30 per 100,000 people on week commencing 24/12/12. However, we were unable to directly compare this peak with school absence data, as this occurred in the middle of the Christmas holidays, so there would have been no absence data available for analysis. Although we can see an increase in illness absences from 03/12/12 to 17/12/12 which corresponds with a rise in the number of individuals going to see their GP about influenza, our school’s illness absence data continued to fluctuate through October and November even when rates of national influenza like illness remained fairly steady, which could suggest that there are other factors that are affecting school illness absence data, such as the possibility that the students are ill with a different infectious disease. Also, there are a number of drawbacks with using GP data, as this data relies on individuals attending the GP surgery themselves and organising an appointment, and as not all individuals that have influenza-like symptoms will visit their GP, the rate provided by GPs may not be entirely representative of the total number of individuals that may have influenza.
Overall, this scheme has been useful for a number of things, such as identifying absence trends within year groups at our school, and being able to compare our school’s absence data due to illness with the nationwide numbers of illness absences. However, there are limitations with the method of comparing school absence data, as crucial data that could help complete a trend is missing, such as the October half term dates and Christmas holidays. As a suggestion for the future, it may be an interesting idea to use this project in a workplace environment, as this could mean more reliable results, as employees are more likely to have a more regular working pattern, and are more likely to have fewer holiday breaks than pupils at schools. Data collection was also an issue originally, as we had planned to go round form groups and get data from form tutors and collect symptoms, but this plan had to be shelved because of lack of cooperation from some form tutors, and inaccuracies in data collection by some members of the group. Because of this, we simply extracted the data off SIMS ourselves, with the assistance of our Head of Science. Another useful addition to this project for next year would be to include the possible symptoms for illnesses as an input box when uploading data, so that it would be possible to differentiate further between influenza and other illnesses that are causing absences.