
peak in the flu data from the national school data
This is our report for decipher my data for the 2011-2012 flu season.
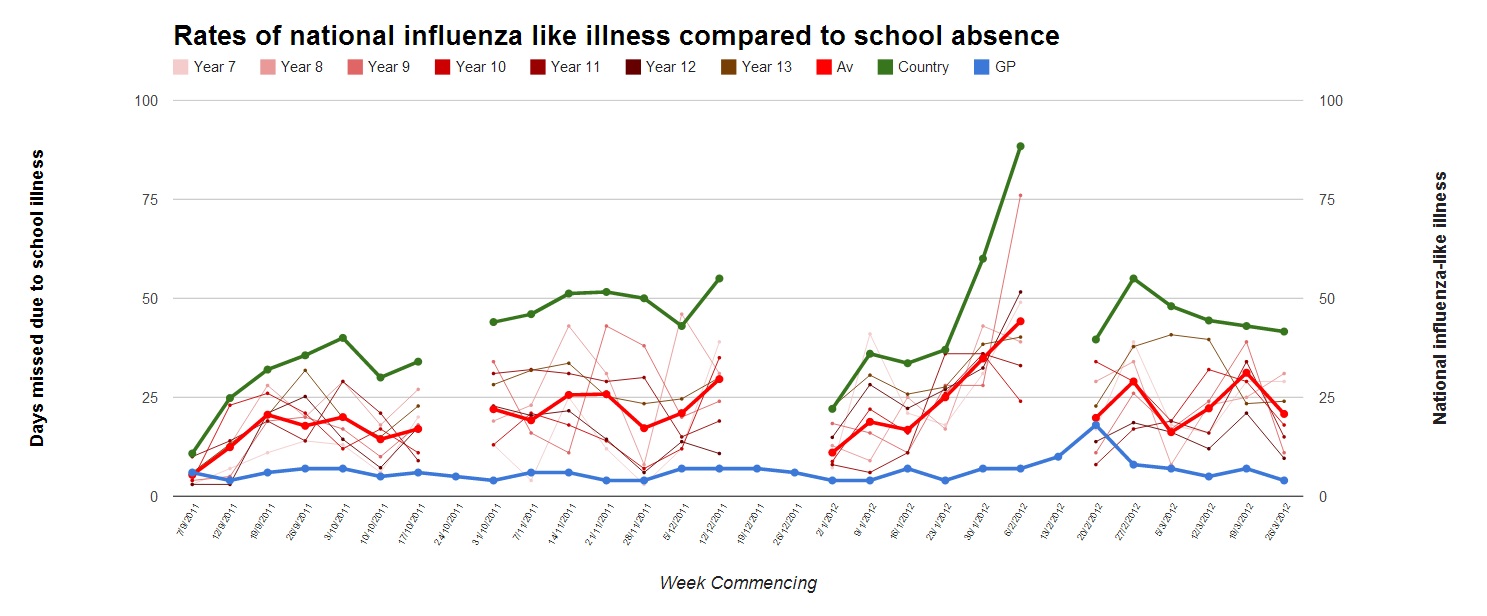
The graph we’ve included shows our school’s data, the data from schools across the country, and the national influenza like illness data from GPs. There wasn’t much flu around this year, which makes it pretty difficult to spot an outbreak of influenza early.
There was a bit of peak in the flu data from the national school data, and this looked like it happened just before the peak in the GP data. However, it’s a bit difficult to tell if that’s really true or not because it was such a small peak.
Our school’s illness data varied randomly a lot throughout the year and we’re not 100% sure why, but we think it might have been because of random variation. During this year we’ve learnt a lot about flu, how you catch it, how to stop it spreading, how to collect data to monitor its spread, and how to analyse the data from the project.
In one way it was good that there was not much flu around this year as it meant not many people got sick, but it did mean that we didn’t get to see whether decipher my data flu worked or not.
