“It’s tricky to know which way the levels will go over the next few weeks, they could go up or down”
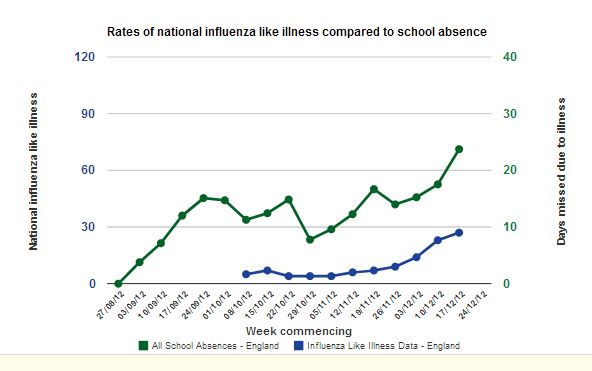
The Flu season has officially started. We’ve noticed that over the past three weeks there has been a reported increase in the number of people visiting their GP with flu like symptoms. The greatest number of those visiting has been children aged 1-4, followed by 5-14 year olds, which shows that there’s almost certainly flu in schools.
While it’s not been a dramatic start to the flu season, with big rises in the number of cases, the data does suggest that there is more flu around than there was at any point last year.
It’s therefore a very important time for DecipherMyData, as we will be able to test our hypothesis of whether school absence data can detect flu peaks early. The graphs on the website really do look promising, but the number of schools who’ve uploaded data so far is small, which means we still need your data! We need your students to analyse the data and write LabLogs. Let me know if you think my hypothesis is working or not? Does you data show a lot of absence from your school? Is it flu or Norovirus?
Now that schools are back, it’s tricky to know which way the levels will go over the next few weeks, they could go up or down. So I’ll be watching our data and the national surveillance reports like a hawk, to see what happens. If I find anything interesting I’ll post it on the blog, and remember to leave LabLogs so I can see how your school is getting on.


