Introduction:
Students learn about how scientists report their findings (including peer review, journal quality, the importance of the “status” of the experimenter etc).
Each group reports their findings to a class “conference” – this could be in the form of a poster presentation, a presentation (video/powerpoint etc), an article / write-up, a press release or a podcast. The best observations are uploaded to DMD for peer review by other schools and for use in Dr Rob’s research. Optional: Students are guided to a section of the DMD site where they are invited to read and rate (peer review) other schools’ submissions.
Prior Learning:
In lesson 1 students learned about types of association that exist between variables and whether there is likely to be any confounding.In lesson 2, they identified patterns in the data for the time-trend analysis and the XY scatter graph analysis. Students added their findings to a LabLog.
Resources:
DMD3-1: DMD3-1 Journal or Journalist (PDF) / [Word]
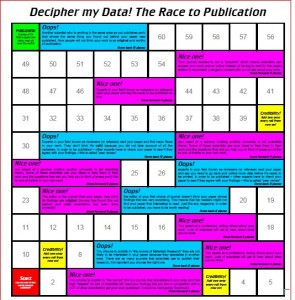
DMD3-2: DMD3-2 The race to publication (PDF) / [Word] (you will need dice and counters for the students)
DMD3-3: DMD3-3 Peer Review Level Ladder (PDF) / [Word]
Key words/ Language:
Peer review (used to determine an academic paper’s suitability for publication)
Evidence (used to determine or demonstrate the truth of an assertion)
Journal (a scholarly publication, most often peer-reviewed)
Learning objectives:
To peer review other scientists’ findings
Learning outcomes:
Students are able to describe the processes that a scientist must go through in order to publish their work and explain how this is different to (for example) a newspaper journalist. Students are able to critically evaluate the quality of other students LabLogs.
Possible APP focuses:
AF5 Thread 4: Explain inconsistencies in the data using scientific knowledge and understanding, comment on how reliable the range of data is, taking into consideration: number of repeats number of data points choice of equipment procedure. See sheet DMD3-3 Peer Review Level Ladder for further info.
Starter:
Watch this video on Peer Review: Journal or Journalist
Students should watch the clip and decide which way of publishing is better for criteria such as
- Speed of getting your story heard.
- Approximate number of people likely to check your story for accuracy.
- Expertise your checkers have in the specific area your story is about.
- Cost to the publisher in printing the story.
- Numbers of people likely to read your story.
- Relevance of people likely to read your story.
- Ease of getting your story published.
They can follow along ticking the appropriate column on sheet DMD3-1 Journal or Journalist (PDF) /[Word]
Discuss the importance of these criteria. Do students think it’s important that scientists always get their work peer reviewed before publishing? What could go wrong if they didn’t do this?
You might also find this sense about science document useful, showing a day in the life of Andrew Sugden, the editor of Science.
Main:
A board game DMD3-2 The race to publication (PDF) / [Word] is provided where students can follow the process of getting work published. This is designed as a camouflaged learning exercise. They are not expected to pick up all the information from the game but should be directed before beginning so that they’re ready to identify one thing that helped them move up the board to get their work published and one thing that hindered them.
After this, students can be given the opportunity to peer review each others data analysis work from lesson two. This could be done in a number of ways…
A writing frame DMD3-3 Peer Review Level Ladder (PDF) / [Word] is provided for your students to peer review other students work. It is editable so you can choose to do as much or as little of the following as suits you.
get students to
- grade each others LabLogs/observations according to the DMD2-2 criteria
- respond formally to the work they are reviewing using the level ladder on DMD3-3 to help them grade the quality of their own response
- recommend the LabLog/observation to be forwarded to Dr Rob or suggest further improvements that would be needed first.
Here are a few suggestions about how you might go about doing this ..
- LabLogs are visible to everyone in the class, you can ask each person / pair to review the LabLog immediately under theirs (with the last group reviewing the first).
- You could print out students’ LabLogs / observations and get them to review each others work in person in a “pair and share” activity.
- Each group could report their findings to a class “conference” – this could be in the form of a poster presentation, a presentation (video/ppt etc), an article / write-up, a press release or a podcast.
Plenary:
At the end of this session, students should decide on a selection of time-trend and XY scatter graph reports from the class to pass on to Dr Rob and his team, who will comment on them and use them in their research. Criteria you could use for selecting the best could include the most unexpected observation, the explanation for a correlation which has the greatest evidence to support it and the highest level observation using the APP criteria. Please send reports into flu@deciphermydata.org.uk.
Extension/ Homework:
You could ask your students to use the peer review level ladder (DMD3-3) to peer review the work published by other schools on the site (coming soon).


