Establishing an electronic system for the collection of routine school absence data
Following an introductory email in the summer term of 2011, 352 teachers expressed an interest in taking part. Of these, 83 registered with the project website in the autumn term of 2011. Across the two seasons, a total of 47 schools returned consent forms and 27 submitted data at least once. There were a greater number of schools in PHE’s southern region (16/27) compared to central (8/27) and northern geographical areas (3/27).
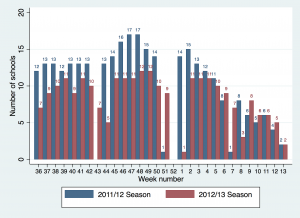
Schools were encouraged to submit absence levels from week 38 until week 13 in the 2011/12 season and until week 12 in 2012/13 (the start of Easter holidays). Several schools provided historical data from week 36 and continued to submit data until week 27 in 2011/12 and week 19 in 2012/13. A mean of 11 (range: 3 – 17) schools submitted data each week during the 2011/12 season and 8 schools during 2012/13 (Figure 1). Data from these schools provided absence information for a mean of 10,231 pupils per week in the 2011/12 and 7,743 pupils per week in 2012/13. No data were uploaded in weeks 43 and 7 in 2011/12, as these were school half terms. In both years no data were uploaded for two weeks during the Christmas holidays. As there was variation in the timings of half term across the schools taking part during the second season, data were uploaded for all other weeks.
Determining if school absence prevalence is associated with established surveillance measures of influenza.
During 2011/12, the mean weighted daily prevalence of school absence due to illness for children in years 7 to 11 was 2.7% (95% CI 2.5, 2.9) between week 38 and 13. There was a peak of 4.1% (95%CI: 3.1, 5.4) in week 6 (Figure 2). Week 7 was a school half term and therefore no data were submitted, and levels in week 8 reduced back to 2.2% (95%CI: 1.3, 3.6). RCGP ILI data (all ages) started to increase in week 5 and peaked during week 7 at 20.1 per 100,000 during the 2011/12 season. This peak was later than seen in previous years and did not cross the threshold of 30 per 100,000 for the entire season, indicating low influenza activity. Datamart microbiological surveillance data on the proportion of samples positive for influenza (A+B) peaked in week 8 at 17.6%, which was also lower and later than the previous two seasons.(6)
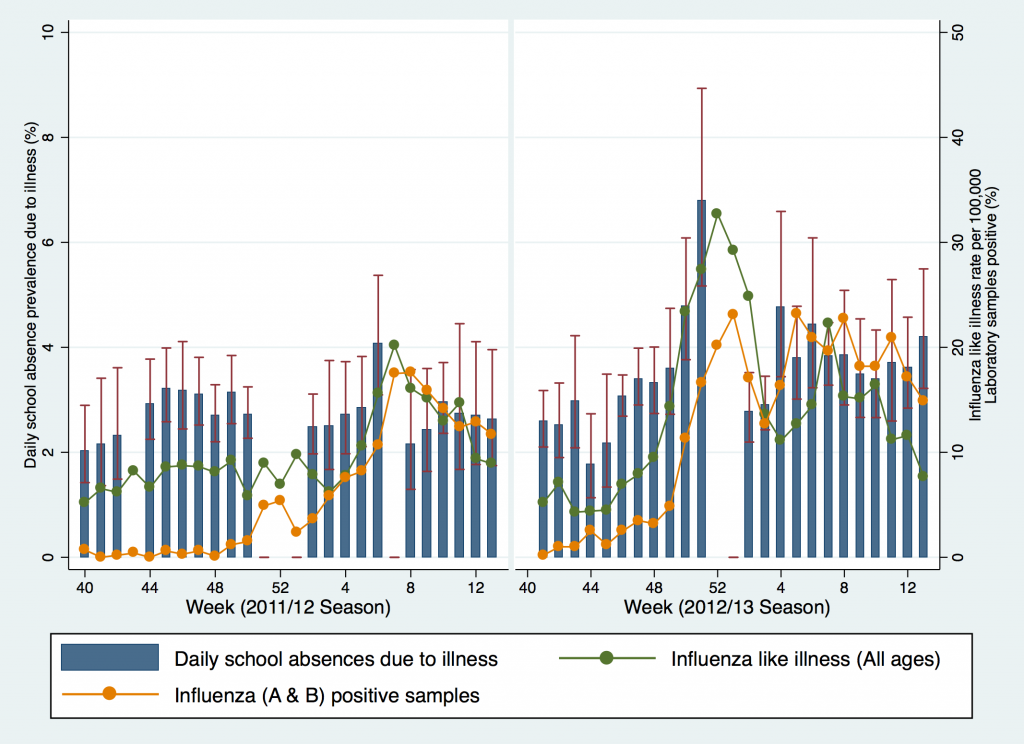
Figure 2. Daily school absence prevalence due to illness (years 7-11), weekly influenza like illness consultation rates to sentinel general practices in England, and weekly proportion of samples positive for influenza (A & B) from Datamart.
During 2012/13, the mean weighted daily school absence prevalence due to illness was 3.4% (95% CI 3,1, 3.7) between week 38 and 12. School absence prevalence peaked in week 51 at 6.8% (95%CI 5.2, 8.9). School absence prevalence reduced to mean seasonal levels in week two at 2.8% (95%CI 2.2, 3.5). RCGP clinical surveillance data of ILI (all ages) peaked at 32.7 per 100,000 in week 52 and was followed by a second smaller peak of 20.2 per 100,000 in week seven. Daily school absence prevalence also showed an increase during this second period, reaching a maximum of 3.8% in week eight (95%CI 3.3, 5.1). The percentage of samples positive for influenza (A+B) in Datamart peaked in week one at 23.1%, and also showed a second smaller peak towards the end of February and the beginning of March. (10) Schools data generally peaking a week before the national surveillance data.
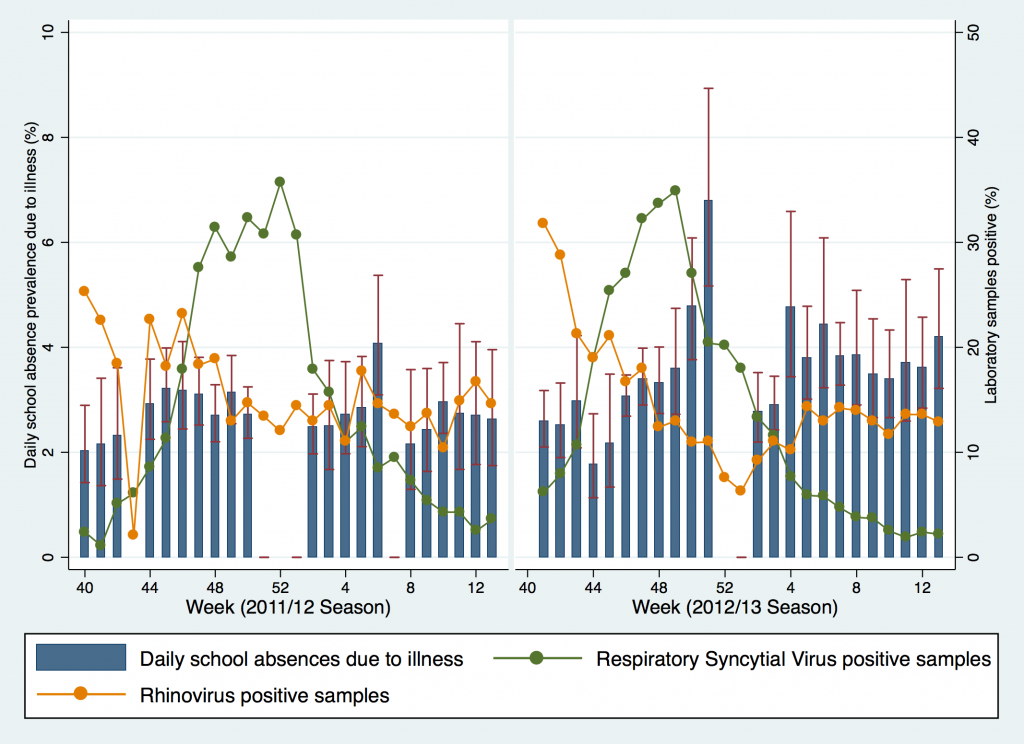
Figure 3. Daily school absence prevalence due to illness (years 7-11) and the weekly proportion of samples positive for RSV and Rhinovirus from Datamart.
Microbiological surveillance data for RSV in 2011/12 showed the highest percentage of positive cases in week 52 at 35.7% (Figure 3). In 2012/13 the peak of RSV occurred in week 49 at 34.9%. The percentage of samples positive for Rhinovirus were highest during week 40 at 25.3%. Rhinovirus levels were also highest at the beginning of the 2012/13 season (31.8% in week 41). The total number of virologically confirmed cases of Norovirus peaked at 464 in week 7 during 2011/12 and 494 in week 50 in 2012/13 (Figure 4). There was no obvious descriptive association between school absence prevalence and these non-influenza respiratory and gastrointestinal infections across the two seasons.
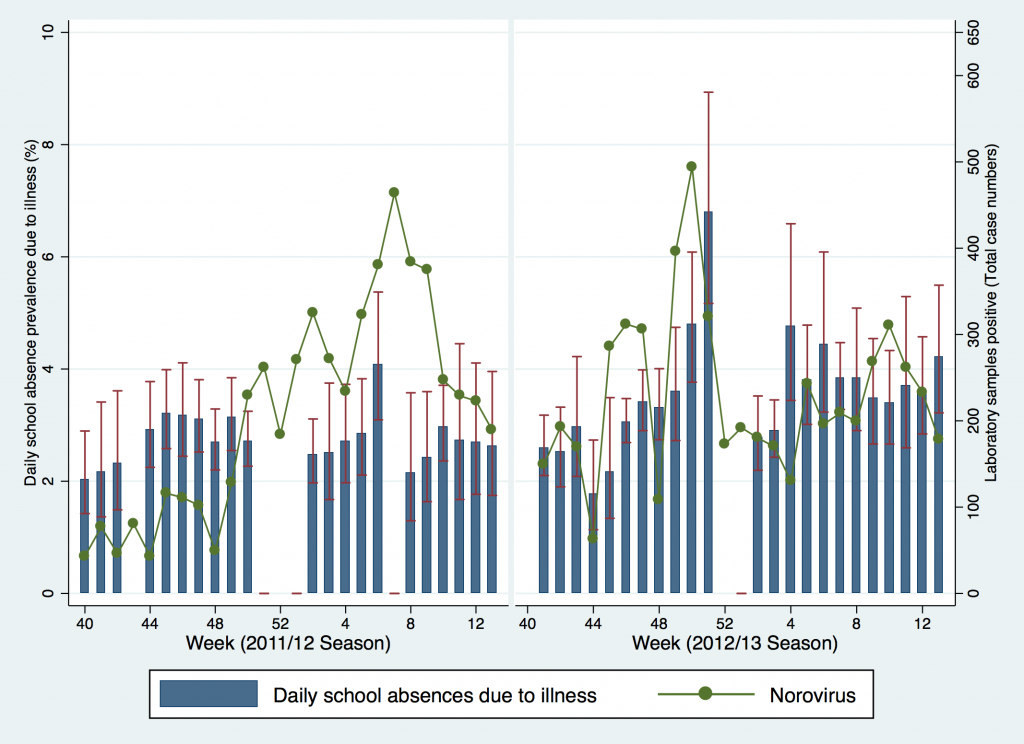
Figure 4. Daily school absence prevalence due to illness (years 7-11) and the weekly number of laboratory confirmed cases of norovirus.
There was strong evidence for a positive linear association between school absence prevalence due to illness across the two seasons with RCGP ILI data for all age groups. For every 1% increase in school absence prevalence, the rate of ILI went up by 0.010 per 100,000 (95%CIs: 0.061, 0.14; p-value <0.001; R2 0.39; Table 1).
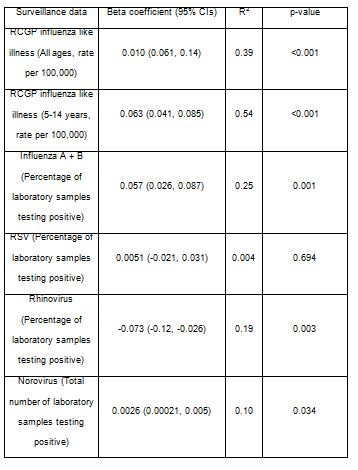
Table 1. Univariable linear regression models examining association between weighted school absence prevalence (years 7-11) and surveillance data for respiratory infections and Norovirus
There was also strong evidence for an association with RCGP influenza like illness in children aged 5-14 years. For every 1% increase in school absence prevalence, the rate of ILI went up by 0.063; (95%CIs: 0.041, 0.085; p-value <0.001; R2 0.25). The proportion of samples positive for influenza A + B submitted to Datamart increased by 0.057 for every 1% increase in school absence prevalence (95%CIs 0.026, 0.087; p-value <0.001 ). The proportion of variance explained by linear regression was greatest for RCGP ILI in children aged 5-14 years, which explaining 54% of the association. There was also some evidence for a linear association with Rhinovirus (negatively correlated) and Norovirus (Table 1).
Public engagement in science
32 Lablogs were completed in year 1 and 18 in year 2. Year 1 also had 50 questions from students that were answered by scientists. The project website was visited 13,604 times by 8,266 unique visitors over the project period. 46,750 pages were viewed. Website activity was was slightly busier in year one. Full results of an independent evaluation of the public engagement aspect of the first year of Decipher my Data are available online.(11) Schools taking part in the project were able to provide interesting additional insights and potential explanations for differences between data from their school and national school absence prevalence, such as weather, teaching environment and other characteristics about the school or local area.
References:
6. Agency HP. Surveillance of influenza and other respiratory viruses in the UK: 2011-2012 report [Internet]. [cited 2014 Mar 13]. Available from: http://www.hpa.org.uk/webw/HPAweb&HPAwebStandard/HPAweb_C/1317134576275
10. Public Health England. Health Protection Report [Internet]. [cited 2014 Mar 14]. Available from: http://www.hpa.org.uk/hpr/
11. I’m a Scientist, Decipher my data! | Real science, real data. [Internet]. [cited 2014 Mar 14]. Available from: https://deciphermydata.org.uk/


