
 Hi, I’m Declan. I’m a teacher who’s been involved with the ‘flu project from the start.
I’m really interested in getting school students involved with current research and learning more about science from inside the process rather than just “How Science Works”. Last year was a massive learning curve for us as no-one has tried anything like this before – I’m really excited we’ve been able to give the project another try.
I’m going to briefly describe how I used the project last year and what I might change for this year.
Getting the head on board!
The first step was to register and get consent. This really was a cinch – a pre-printed letter is provided and I just had get it signed by the head and leave it in the office to be faxed. Some teachers I spoke to said they had difficulty getting their head to agree to releasing the data but I think that’s because they weren’t stressing the fact that this is illness data not baseline absence – there’s nothing in it that could reflect badly on the school.
Data delivery
I next went and smiled sweetly at our lovely absence administrator. We have a small script that load straight into SERCO absence platform and instructions for CAPITA (SIMS). I showed her where the script was for our system and from then on she was provided with the data she needed just by clicking a button. The output comes as a spreadsheet – its in exactly the same format that you enter data on the site with. I think the key to success here was getting it into the administrator’s workflow. At first I had to ask for it but soon the data arrived every week in my inbox automatically. It then took 30 seconds to enter.
What’s happening this year?
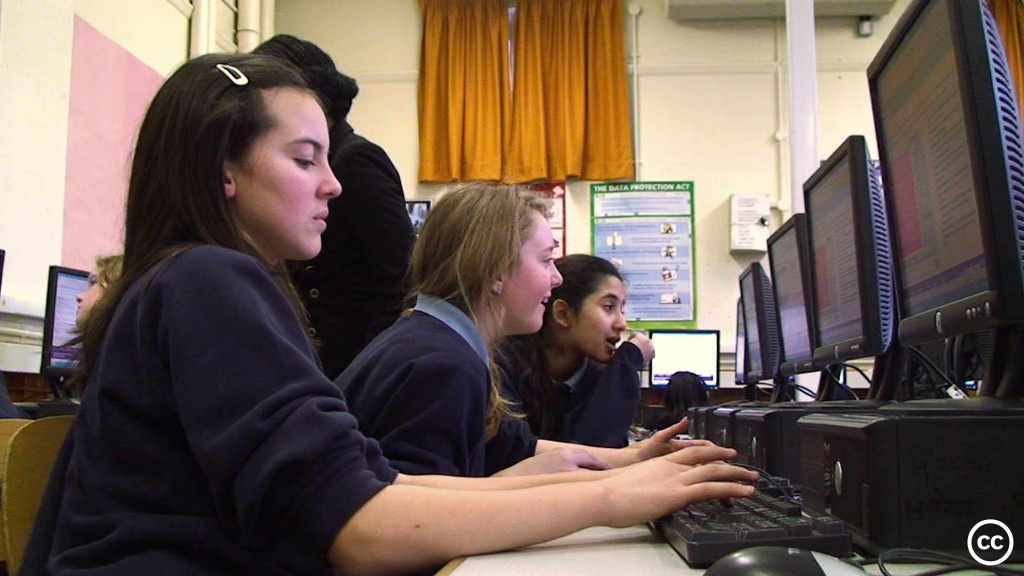
I really did do everything in 3 lessons last time. Image by Jorge Barrios
This year the project is a lot more relaxed about when and how you upload your data. I think mistakes were made in communication last year about how best to introduce the project. Some teachers introduced it to their classes right at the start and looked at the data every lesson. As nothing happens for most of the year this was going to get pretty tiresome! I mentioned to my year 8s roughly what it was about but didn’t really do anything with the project ’til we got onto the Microbes and Disease topic. That happened to fall just after the flu peak. I’d advise waiting for a flu peak before going into the project in too much detail, so your students can actually see patterns emerging.
This year we’re asking if you can upload data regularly that would be amazing but you could also upload chunks more sporadically. As soon as we think we see a peak kicking off we’ll send out an alert asking people to get their current data up for everyone to use.
Another major issue with a lot of teachers was lesson time. There’s not a lot we can do about that but I can say that I really did do everything in 3 lessons last time. If I’m honest I’ll probably take four lessons this year. My year 8s were struggling with the concept of variation in data and weren’t seeing the link between how wobbly the line was and the number of students that line represented. This made it hard for them to evaluate what the graph was really telling them. Later in the year I’ll focus a little more on the successes and difficulties I had with the analysis and address those issues. The changes we’ve made ensuring that the graph doesn’t drop to zero in the holidays will make it easier for the students to see what’s going on as well.
 If lesson time’s especially tight, the project can be used with science clubs following a similar format and we’ve also heard from a few schools who’d handed the project hook, line and sinker over to A-level students to use as the basis for an EPQ. Get in touch with us if you want to give additional privileges to one of your students to they can upload data themselves.
What’s around the corner?
I’m really excited to see what this year’s flu has in store for us. There’s the possibility of a new swine flu around the corner (Dr Rob will be writing about this soon) which is currently only affecting school-age children. I know my students are going to be fascinated by this, and after last year’s record low ‘flu levels, surely things can only improve this year!
In short:
- Consent really is easy
- Get your absence officer on side – with the scripts we’ve built getting the data is really easy.
- If you’re planning on doing the project with a class – don’t introduce it to them too early in the year as you’ll find it difficult to sustain momentum.
- Let us know how you’re using the project – the suggested lesson plans are just that!
