Infections other than flu could influence the school absence data. In this post, Dr Rob looks at whether two other common viruses influence DecipherMyData’s results.
As some of you highlighted in the LabLogs, a big limitation with our school absence data is that we don’t collect information on the reason for school absence. So an important question for us to ask is: are there any associations between other infectious diseases and the illness absence levels?
There are plenty of other diseases for us to look at, but a good starting place is other common respiratory viruses. Two of these are rhinovirus and respiratory syncytial virus (RSV) and fortunately there’s also good data collected about each one.
Each week the Health Protection Agency collects the results of tests performed for respiratory viruses in selected hospitals across the country. Using these data they then calculate the proportion of people tested for which a virus was detected. As the proportion of people with a virus goes up, the more of a virus there is going around.
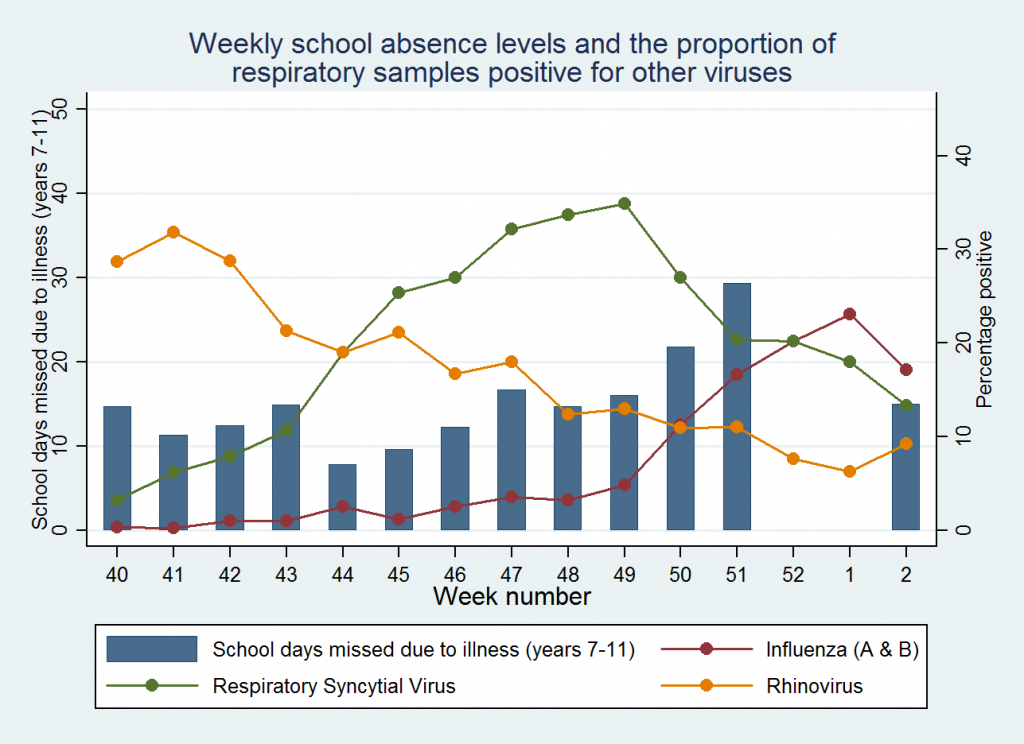
In the graph above I’ve plotted our school absence data against the proportion of tests positive for influenza, rhinovirus and RSV each week. The data is all available online, but to save you going through each report (like I did!)..
I’ve put the results in a spreadsheet here. That way you could plot your school’s data against levels of the three viruses.
Looking at levels of the three viruses: rhinovirus levels have generally been going down since week 43; RSV levels started off around 10, peaked at 35 in week 49, and decreased since then; influenza levels started off very low and peaked at 23 in week 1.
Our school’s data bumps around at the beginning of the year and at the moment shows a peak in week 51 just before Christmas. We then had school holidays during week 52 and week 1 (so we don’t have any data) and when schools come back it drops back down a bit.
What can we conclude? Well, I think the results are interesting but not conclusive. There doesn’t appear to be much of an association with rhinovirus or RSV, but some association with influenza, particularly in the later weeks.
That’s exciting as it suggests are results are doing the right thing – being associated with influenza but not with RSV or rhinovirus. However, at the moment the school data varies a lot at the beginning of the year, which means that the peak in week 50 and 51 could just be the data bumping around, especially as we don’t have many results in week 50 and 51 so these results in particular could be due to chance. As more data are uploaded, this random variation will probably smooth out, and we’ll be able to be more certain about whether there really is a peak or not.
Further analysis will also involve looking for associations with other measures of influenza (we already plot it against the GP data on the website, but there are other sources we will use) as well as looking for associations with other infections such as Norovirus. If you look at the associations with your school data and other infections, don’t forget to let me know what you find in the LabLogs.


