Research projects tend to go on for a long time, but to me at least, this one has gone in a flash. It only seems like yesterday when we began collecting data from schools, but in fact we actually collected live data for 14 weeks, and because we asked schools to submit data retrospectively (so that we could quickly establish a baseline rate of school absences) in total we actually have data from 25 school weeks. At the peak of the data collection we have absence levels from 17 schools across the country and a total of nearly 17,000 pupils, which is pretty impressive.
That’s a lot of data and obviously the next logical step is to think about whether we can answer the project’s research question, which was: can school absence data detect flu peaks early?
The first thing we needed to do was establish the baseline level of school illness absence so that we would know when something abnormal was happening such as a flu peak. Our excellent set of data shows us that for the participating schools it is between 10 to 14 days per 100 pupils a week.
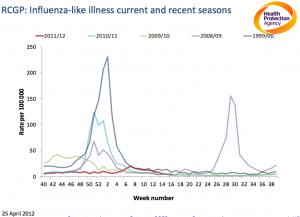
 Knowing that set us up nicely to be able to detect a peak if and when one arose. I say if, because as you’ll have seen this year has seen an abnormally low number of cases of flu. This makes detecting a peak much trickier obviously, because like in the real world, looking for something small like your keys is obviously much harder than looking for the car to put them in.
The national influenza surveillance data peaked in week 7, which was actually a school holiday so we weren’t collecting data for that week and is one of the major limitations of this project. However, all is not lost and an early look at the data is promising as school absences peaked in the previous week 6 which is very encouraging because even though we don’t have data for the highest week, the timings are definitely right.
We’ll be doing lots more analyses over the coming weeks and I’ll be writing more blogs about this. We’ll also be deciding what to do next. One thing is certain, which is that scientists like to be able to repeat results as many times as possible to check they get the same results each time. So if we think schools are still interested in taking part in the project, and if we can get the money to run it again, then we’ll be back again next year before you know it!
So what does this mean for you and your students? Firstly the lack of a strong peak does make it more difficult for you to analyse your data and report it back to me. Because of that we’re not expecting anything from you, but if you do have something you want me to look at then please email it through.
Secondly it means that we are unlikely to attempt to get a paper published. We’ve got lots of data from our schools including many interesting findings worth publishing but we’ll need to get data from a more typical year before we’d be ready to write it up for an academic paper. The current plan is to try to repeat the work next year and if, as expected, there is a stronger peak then we can better answer to the original research question.
Scientific experiments don’t always turn out quite as planned and we certainly didn’t think we’d see such low levels of flu this year. We hope this might be a useful learning point for the students – we don’t always get the data, but this doesn’t mean we’ve failed, it’s just the nature of science. We now have to pick ourselves up, dust ourselves down and get ready for next season.
I hope that you and students will take part again. We’re going to make some changes to simplify the project and make it easier to do. You should hear about that later in the Summer term.
Once again thank you for every piece of data you uploaded. Things may not have gone exactly as expected, but it has been a very useful science project for us and I hope for you.


