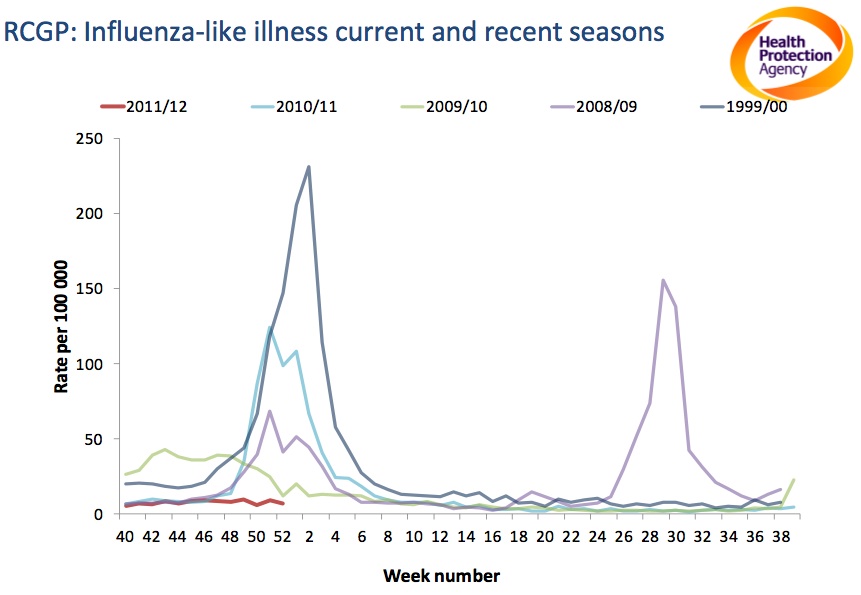
The school holidays over Christmas might have given schools a welcomed break but they also stopped us from collecting data for couple of weeks. This is one of the main scientific limitations of this project, as it means we can’t monitor what’s going on during this period using school absence levels. Despite the break in school data, we’re still able to look at national data using the current surveillance systems, such as counting the number of people that go to see their GP with influenza like illness.
National data from the Health Protection Agency’s (HPA) latest surveillance report indicates that some markers of activity started to increase in the middle of December but overall levels of flu are still low.
Other HPA data based on previous year’s influenza like illness, is  plotted in the graph. It shows that, if we’re going to see an increase, it is very likely to occur at some point over the next month or so. So I’ll be looking very closely at the reports for the coming weeks to see if we start to see a real increase.
All of this makes school data over December and January very important. This will help us understand whether school absence data can be used to detect an increase in influenza activity before current surveillance systems.
Graph source: HPA/RCGP


